Our planetary footprint is growing at an astounding rate
Each year we are mining more than our ancestors did in multiple generations
I began researching Material World in the midst of the Covid pandemic. It was a miserable period, and much of my time was bound up covering the miserable data from this country and others showing the exponential rise in cases and deaths in each of the waves of the disease. I had exponential curves and doubling times constantly echoing in my head, and in a strange way, researching the weird wonderful world of minerals became a kind of escape.
But even in this escape I found myself constantly coming across data series with lines and charts which looked oddly reminiscent of the ones I was dealing with day to day as we in the media charted the progress of Covid-19. These charts were exponential, with similar curves, rising slowly and then getting steeper and steeper, but they weren’t charting the progress of a virus but the footprint of humankind.
That brings us to a statistic quite early in the introduction of Material World which I find pretty astounding:
In 2019, the latest year of data at the time of writing, we mined, dug and blasted more materials from the earth’s surface than the sum total of everything we extracted from the dawn of humanity all the way through to 1950.
I figured it might be worth providing a little more detail and showing my working on this because a) it means I get to show you some of the charts and data underlying the book, which is what this blog is really all about, b) I recently realised with horror that for some reason I didn’t provide a footnote for that particular stat, so consider this a lengthy footnote. Also, c) because it gets to a bigger point, which is that far from becoming less reliant on the physical world all around us, the amount of mining and exploitation - and, generally speaking, our footprint - is greater than ever before.
There’s something else important here. You’ve probably heard of the concept of the Anthropocene, the notion that we are living in an entirely new geological age defined by humankind’s impact on the planet. This is, it’s worth saying, a live story but most geologists (though not all) think that the probable date the Anthropocene began was around about 1950. Looking at data like this provides a useful statistical backbone for such ideas.
Before we go any further, though, it’s worth underlining that the data on this kind of thing - humankind’s history of mining and exploitation of the planet - is not brilliant. Perhaps the most authoritative data on how much we plucked out of the ground comes from the UN Environment Programme’s Resource Panel. One handy way of navigating the data is via the Material Flows website where you’ll find charts like this one:
And the takeaway from charts like this is pretty clear. Our footprint is not shrinking; it’s growing! Sure, in countries like the UK and US it’s falling somewhat (partly this is because we tend to import most of the dirty stuff from overseas these days but even once you adjust for that, the footprint is shrinking slightly in many rich countries), and once you adjust for population it looks like it may be plateauing. But across the planet as a whole, it’s still rising.
Another striking thing about these charts is that when you break down the constituent parts, by far and away the biggest component is not fossil fuels (which understandably gets the most attention) but construction materials. Sand, aggregates and rock are comfortably the biggest thing we dig and blast out of the ground - to turn into new land, to turn into roads and to turn into the concrete from which we build our cities and our infrastructure.
But there are a few problems with this data. The first is that it’s incomplete. A lot of sand mining, for instance, happens on the black market and so the Resource Panel has to do some guesswork about the real numbers. We just don’t have a great handle on this stuff, so you have to be a bit cautious. Moreover, the data here is also incomplete. Consider a metal like copper. While it counts the copper that eventually comes out of a refinery, it doesn’t take account of how much ore was removed to get it, nor of the waste rock which gets piled up alongside copper mines. This stuff simply doesn’t get accounted for. In data terms, it doesn’t really exist - yet it’s a pretty obvious and eye-catching part of our footprint!
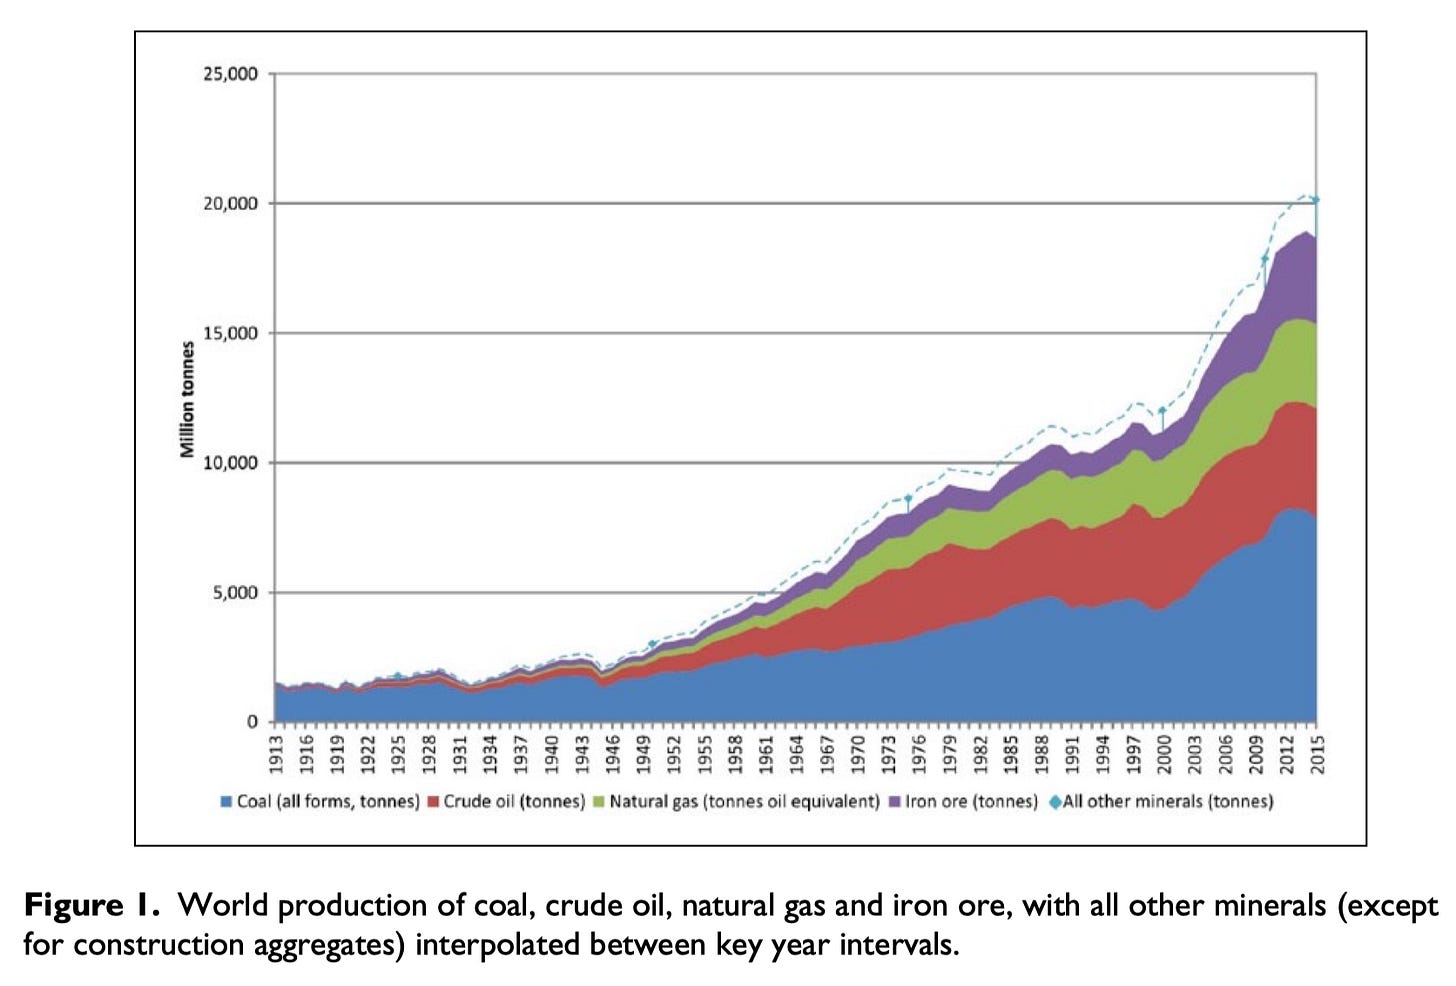
The second issue is that this data series only goes back to 1970. So if you want longer-run data you have to look elsewhere. One place with data going back further is the British Geological Survey, whose annual surveys of global mineral extraction go back to 1913.
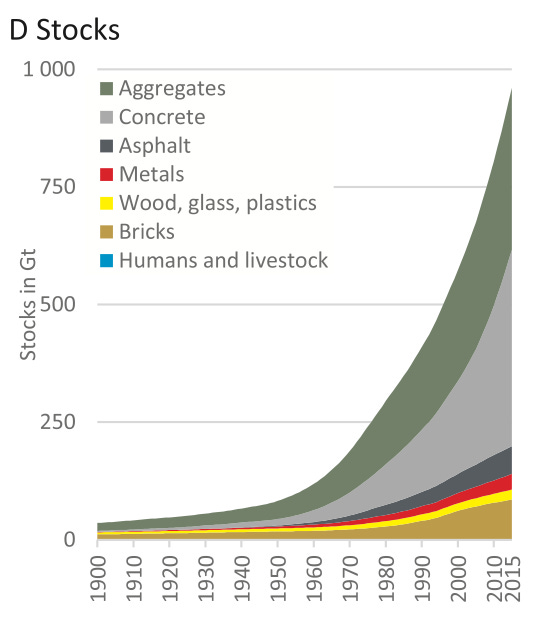
That’s helpful. But what if you want a sense of something else: the total stock of stuff we’ve pulled out of the ground over time? Then you have to do a fair bit of estimating the total amount of mining, refining, digging blasting and recycling we’ve done to get the physical things we’ve had throughout history. Thankfully a few years ago some academics did precisely that. Their paper includes all sorts of striking charts, including this one, which looks at the total stocks of materials - in other words the metals and bricks and other substances we humans have plucked from the ground.
According to the dataset attached to the paper, the total “stock” of human made materials in the world was, as of 1950, just over 82 billion tonnes - or, including 1950, 85 billion tonnes. And as you see from the chart above, it’s after 1950 that that figure really starts to accelerate: that we both began to deploy concrete and steel and other materials at a truly astounding rate, while also growing the population so rapidly that the curve went upwards.
According to those UNEP Resource Panel figures, as of 2012 we were routinely extracting over 89 billion tonnes of materials from the ground each year. And the rate has only increased since. As of 2019 it was up to 96 billion tonnes. In other words, in these recent years we have been routinely removing more stuff from the ground each year than the total stock of stuff we had removed from the ground up until 1950.
There are a couple of provisos. The first is that these figures above aren’t just metals and construction materials - they also include biomass. Remove that - the crops and crop residues, the fish and wood - and you end up with an annual total of around 70 billion tonnes. But there’s good reason to presume this too is an undercount, since (as I wrote above) the figures from UNEP don’t take full account of the waste rock and ditched ore that in the case of some metals and materials are far greater and heavier than the “useful” stuff that comes out of the ground.
Either way, what you see when you look at pretty much any of these long run datasets of human exploitation is that they look a little like one of those Covid epidemic curves. Check out this alternative measure from another paper - this one based not on the Resource Panel data but on that BGS dataset.
The conclusion of that paper, which attempts to count not just the finished metals coming out of the ground but also that waste rock which some other sources don’t count - is that “Humans are now the major global geomorphological driving force and an important component of Earth System processes in landscape evolution.” And indeed when you look at the data in this Cooper paper you find a similar pattern to the one you see elsewhere: that our annual material extraction these days is similar to the net total extraction in the years up to 1950.
There’s another interesting paper which finds that all the human-made stuff on the planet now weighs more than all the natural living biomass. Again: same thing: another exponential chart which looks not unlike those Covid charts.
Our footprint isn’t shrinking. It’s still growing at a rapid rate. And while it’s certainly true that cutting back on fossil fuels will take a big chunk out of this growing mountain, it’s not altogether clear that won’t be outweighed by the continued rise in our exploitation of other stuff - sand, stone, aggregates, metal and everything else we use to make the modern world.
The good news is that at some point these curves will, much like the Covid-19 ones which seemed to be going ever upwards, peak and dip down. At least I assume so. Either population peaking and decline will do it, or, hopefully, it’ll happen as we get more efficient at making and using stuff.
We’ll mine much less in the way of fossil fuels (and mostly mine it to make stuff rather than mining it to burn it). Unlike a barrel of oil, a battery can be mostly recycled once it’s used. Our footprint can eventually shrink. But the overarching message of Material World is that getting there - building out that infrastructure we need to get us to that promised land - is likely to involve even more exploitation than ever before.


